
Written & Clinically Validated by: Dr. Apurva Tamhane, Principal Practitioner & Healthcare Entrepreneur
Reviewed for Clinical Accuracy: Dr. Rajendra Balkrishna Tamhane
Editorial Note: Drafted with the assistance of Gemini AI; all medical concepts, lab interpretations, and clinical recommendations were independently verified, revised, and approved by Dr. Apurva Tamhane.
Objective: Demystify routine lab work and empower readers to understand their baseline health metrics.
💡 Key Takeaways (TL;DR)
Introduction
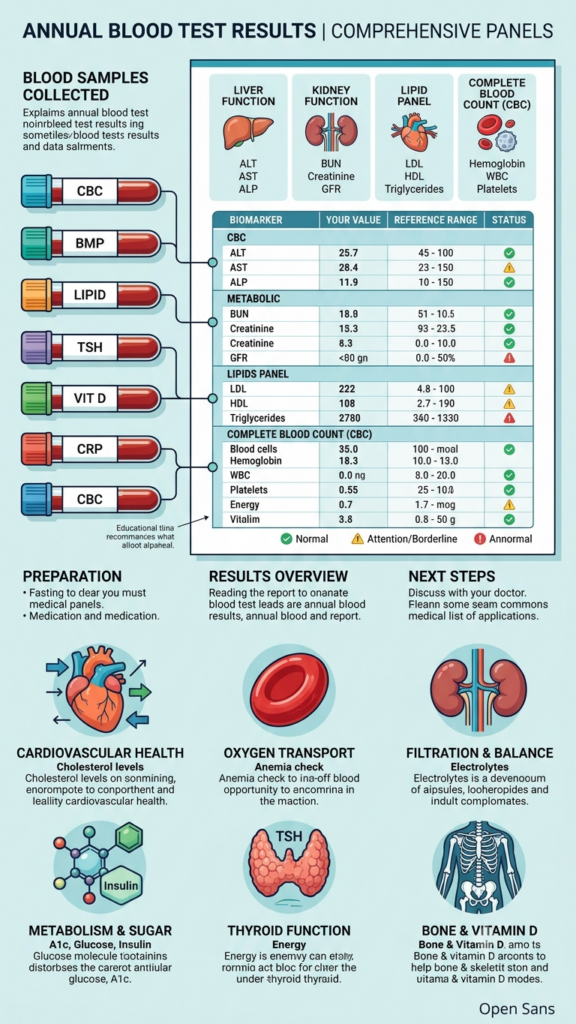
Having your annual blood test results explained by a medical professional is one of the most effective ways to take charge of your long-term preventive health. Modern preventive medicine relies heavily on objective clinical markers rather than waiting for obvious symptoms to emerge. While feeling energetic and healthy is always the ultimate goal, many significant physiological shifts—such as early insulin resistance, subtle liver enzyme elevation, or gradual arterial stiffness—occur silently without causing immediate physical discomfort. A comprehensive annual blood test serves as an indispensable diagnostic window into your internal physiology. It provides a clear, quantitative audit of your cellular health, organ function, metabolic efficiency, and nutritional reserves long before clinical disease has a chance to take root.
However, receiving a multi-page laboratory report filled with chemical acronyms and numerical ranges can feel overwhelming for most patients. The common reaction is to scan the page quickly for bolded values or flags that sit outside the “standard reference range”. While these boundaries are essential for catching acute disease, relying solely on a simple pass-or-fail interpretation misses the true diagnostic power of routine testing. Understanding your blood work requires looking deeper than a single snapshot in time.
Why “In Range” Isn’t Always the Full Story: Trends vs. Single Numbers
A standard laboratory reference range is determined statistically by evaluating a wide cross-section of the population—a group that includes individuals across a vast spectrum of age, activity levels, stress, and underlying health states. Consequently, a result marked “in range” simply means your number falls within the broad average of that tested population, not necessarily that it is optimal for your personal biology. Sitting at the very upper limit of a normal range for fasting glucose or liver enzymes might technically generate a clean report, yet it could simultaneously signal an early trajectory toward metabolic strain.
Furthermore, a single isolated blood test is only a single data point on a timeline. Biological markers naturally shift due to temporary variables like daily hydration, sleep quality, recent exercise, or minor dietary changes. Having your annual blood test results explained in the context of your historical baseline reveals the real clinical value: tracking your personal trajectory over multiple years. For instance, if your fasting blood sugar is technically inside the normal limit at 98 mg/dL, but your historical reports show it steadily climbing from 82 mg/dL over three consecutive years, that upward trend tells a vital clinical story. Catching that pattern early empowers you and your physician to make targeted lifestyle modifications decades before chronic dysfunction develops.
1. Complete Blood Count (CBC): The Body’s Diagnostic Snapshot
When your annual blood test results explained by a clinician, the Complete Blood Count (CBC) is almost always the starting point. Knowing how to read blood test report data—especially understanding standard CBC lipid profile normal ranges—empowers patients to actively participate in their own preventive healthcare. The CBC serves as a comprehensive diagnostic snapshot, measuring the cellular components of your blood to reveal vital insights about your overall systemic health, immune status, and oxygen-carrying capacity.
Hemoglobin & RBCs: Oxygen Delivery and Screening for Anemia
Red blood cells (RBCs) and their oxygen-carrying protein, hemoglobin, form the bedrock of your circulatory efficiency.
- The Clinical Standard: Hemoglobin measures the concentration of oxygen-transporting proteins in the blood, with standard healthy ranges typically falling between 13.5 to 17.5 g/dL for adult males and 12.0 to 15.5 g/dL for adult females.
- The Clinical Benefit: Monitoring RBC indices allows clinicians to screen for various forms of anemia or polycythemia. Ensuring optimal hemoglobin levels guarantees that adequate oxygen is delivered to active tissues, preventing chronic fatigue, weakness, and cellular hypoxia.
WBC Count: Identifying Active Infections and Inflammation
White blood cells (WBCs) act as the primary cellular defenders of your immune system, patrolling the bloodstream for foreign invaders.
- The Clinical Standard: A standard total WBC count generally ranges from 4,500 to 11,000 white blood cells per microliter of blood, with distinct differential breakdowns for neutrophils, lymphocytes, monocytes, eosinophils, and basophils.
- The Clinical Benefit: An elevated WBC count (leukocytosis) frequently signals an acute bacterial or viral infection, tissue necrosis, or systemic inflammation. Conversely, a depressed count can highlight immune suppression or bone marrow stress, providing an early warning sign for clinical intervention.
Platelets: Assessing Blood Clotting Capacity
Platelets (thrombocytes) are specialized cellular fragments essential for hemostasis and wound repair.
- The Clinical Standard: The typical reference range for a healthy adult platelet count spans from 150,000 to 450,000 platelets per microliter of blood.
- The Clinical Benefit: Tracking platelet counts ensures that your blood maintains a delicate balance—preventing excessive, uncontrolled bleeding while avoiding spontaneous clotting risks. Abnormalities in this parameter prompt further evaluation of bone marrow function, autoimmune activity, or medication side effects.
National Institutes of Health (NIH) reference ranges
2. Lipid Profile: Reading Beyond Total Cholesterol
When your annual blood test results explained by a medical professional, the lipid panel is often the most critical window into your long-term cardiovascular health. Knowing how to read blood test report data—particularly understanding standard CBC lipid profile normal ranges—allows patients to look past a single “total cholesterol” figure and evaluate their actual coronary risk. A comprehensive lipid panel measures several distinct circulating fats and lipoproteins, each playing a unique role in arterial health.
LDL vs. HDL: “Bad” vs. “Good” Cholesterol Demystified
Low-density lipoprotein (LDL) and high-density lipoprotein (HDL) behave in fundamentally opposite ways within the circulatory system.
- The Clinical Standard: Optimal LDL cholesterol (“bad” cholesterol) levels are generally recommended to be below 100 mg/dL, as excess circulating LDL contributes to atherosclerotic plaque accumulation in arterial walls. Conversely, HDL cholesterol (“good” cholesterol) acts as a scavenger, with protective levels typically targeted above 40 mg/dL for men and 50 mg/dL for women.
- The Clinical Benefit: Differentiating between LDL and HDL helps clinicians assess whether cholesterol is actively depositing in your arteries (high LDL) or being successfully transported back to the liver for clearance (high HDL).
Triglycerides: The Link Between Diet, Lifestyle, and Blood Fats
Triglycerides are the most common type of fat stored in your body, derived from excess calories, simple sugars, and refined carbohydrates.
- The Clinical Standard: A normal fasting triglyceride level is categorized as less than 150 mg/dL, with higher readings signaling potential metabolic imbalances.
- The Clinical Benefit: Tracking triglycerides provides immediate clinical insight into how your dietary habits, physical activity levels, and metabolic processing interact. Elevated triglycerides frequently correlate with insulin resistance, sedentary habits, and an increased risk of metabolic syndrome.
American Heart Association lipid guidelines
Key Ratios: Why Overall Balance Matters More than a Single Figure
Focusing solely on isolated numbers can sometimes mask underlying cardiovascular vulnerabilities, which is why clinicians place heavy emphasis on lipid ratios.
- The Clinical Standard: Ratios such as Total Cholesterol-to-HDL or LDL-to-HDL provide a proportional view of atherogenic particles versus protective particles. For instance, maintaining a total-cholesterol-to-HDL ratio well below 5.0 (ideally under 3.5) indicates favorable balance.
- The Clinical Benefit: Key ratios offer a more accurate predictor of cardiovascular events than any single lipid parameter alone, helping to tailor preventive interventions and lifestyle modifications effectively.
3. Metabolic & Blood Sugar Markers
When your annual blood test results explained by your healthcare provider, metabolic and glycemic markers serve as vital indicators of how your body processes dietary carbohydrates and manages energy regulation. Knowing how to read blood test report data—alongside understanding standard CBC lipid profile normal ranges—is essential for catching metabolic shifts long before they manifest as overt clinical disease. Evaluating your fasting glucose and long-term glycemic averages provides a clear window into your overall metabolic health.
Fasting Blood Glucose: Catching Early Blood Sugar Spikes
Fasting blood glucose measures the concentration of circulating glucose in your bloodstream after an overnight fast, offering a snapshot of your body’s immediate insulin response.
- The Clinical Standard: A normal fasting blood glucose level for a healthy adult generally falls between 70 to 99 mg/dL. Readings between 100 and 125 mg/dL indicate impaired fasting glucose (prediabetes), while measurements consistently at or above 126 mg/dL point toward diabetes.
- The Clinical Benefit: Tracking this marker allows clinicians to catch early glycemic abnormalities and insulin resistance, providing an actionable opportunity to reverse metabolic drift through targeted dietary and lifestyle interventions.
World Health Organization (WHO) diabetes diagnostic criteria
HbA1c: Understanding Your 3-Month Average Sugar Control
While fasting glucose gives a single daily measurement, glycated hemoglobin (HbA1c) provides a long-term retrospective view of your blood sugar regulation.
- The Clinical Standard: The HbA1c test measures the percentage of your red blood cells that have glucose-coated hemoglobin, reflecting your average blood sugar levels over the past 8 to 12 weeks. A normal non-diabetic range is typically below 5.7%, with 5.7% to 6.4% indicating prediabetes and 6.5% or higher confirming diabetes.
- The Clinical Benefit: Because red blood cells live for roughly three months, HbA1c is immune to day-to-day fluctuations caused by a single meal or acute stress. It remains the gold-standard metric for assessing cumulative glycemic control, evaluating treatment efficacy, and preventing long-term microvascular and macrovascular complications.
4. Kidney & Liver Function Indicators
When you have your annual blood test results explained by a medical professional, metabolic panels frequently look beyond blood sugar and fats to evaluate your body’s primary filtration and processing centers. Knowing how to read blood test report metrics—while keeping standard CBC lipid profile normal ranges in perspective—requires a close examination of your renal and hepatic panels. These biochemical markers reveal how efficiently your organs clear metabolic waste products and synthesize essential proteins.
Creatinine & BUN: Evaluating Kidney Filtration Efficiency
Your kidneys act as the body’s master filtration system, constantly clearing metabolic waste and regulating electrolyte balance.
- The Clinical Standard: Serum creatinine (a byproduct of normal muscle breakdown) typically ranges from 0.6 to 1.2 mg/dL, while Blood Urea Nitrogen (BUN)—reflecting protein breakdown metabolism—generally falls between 7 and 20 mg/dL.
- The Clinical Benefit: Tracking creatinine and BUN allows clinicians to estimate your glomerular filtration rate (GFR). Elevated levels suggest that renal clearance is compromised, providing an early warning sign of kidney stress, dehydration, or chronic kidney disease.
SGOT/SGPT & Bilirubin: Assessing Liver Cell Health and Processing
The liver is your body’s biochemical powerhouse, responsible for detoxification, protein synthesis, and metabolic regulation.
- The Clinical Standard: Liver enzyme tests, including Serum Glutamic-Pyruvic Transaminase (SGPT/ALT) and Serum Glutamic-Oxaloacetic Transaminase (SGOT/AST), generally fall within a normal range of 10 to 40 U/L. Bilirubin (the byproduct of old red blood cell breakdown) typically ranges from 0.2 to 1.2 mg/dL.
- The Clinical Benefit: When liver cells are inflamed, injured, or overworked, these enzymes leak into the bloodstream. Monitoring SGPT, SGOT, and bilirubin levels helps detect early signs of fatty liver disease, medication-induced stress, or biliary tract congestion long before clinical symptoms appear.
5. Key Vitamins & Minerals Often Overlooked
When having your annual blood test results explained by a clinician, standard panels often focus solely on organ function, leaving crucial micronutrients unexamined. Knowing how to read blood test report details means looking beyond basic metrics—such as standard CBC lipid profile normal ranges—to include essential vitamins that govern daily cellular energy, immune defense, and neurological function. Among these, Vitamin D3 and Vitamin B12 are frequently overlooked despite widespread deficiency patterns in modern populations.
Vitamin D3 & B12: Essential Levels for Energy, Bone, and Nerve Health
Micronutrient testing provides vital windows into foundational cellular processes that impact everything from fatigue to long-term skeletal integrity.
- The Clinical Standard: Optimal serum 25-hydroxyvitamin D3 levels are generally targeted above 30 ng/mL, while serum vitamin B12 levels should ideally fall between 200 to 900 pg/mL, depending on laboratory specifications which in turn help with good ergonomics.
- The Clinical Benefit: Subclinical deficiencies in D3 and B12 are notorious for presenting vague, systemic symptoms such as chronic fatigue, muscle weakness, mood disturbances, and peripheral tingling. Routinely tracking these micronutrients ensures early detection, preventing long-term complications like bone demineralization, megaloblastic anemia, and irreversible neurological strain.
Office of Dietary Supplements (NIH) micronutrient guidelines
Conclusion & Next Steps
Having your annual blood test results explained is not a static yearly event, but rather a dynamic tool for tracking your long-term health trajectory. Knowing how to read blood test report data—and understanding where your metrics fall relative to standard CBC lipid profile normal ranges—empowers you to take an active role in preventive care. Lab reports should serve as an actionable roadmap for lifestyle adjustments, early interventions, and meaningful dialogues with your healthcare provider.
How to Archive Your Lab Results Over Time
A single set of lab results provides a snapshot in time, but tracking your biomarkers across multiple years reveals critical trends.
- The Record-Keeping Standard: Maintain a centralized digital or physical health archive where every annual report is stored chronologically. Create a simple spreadsheet tracking key parameters—such as fasting glucose, HbA1c, LDL, HDL, and Vitamin D3—year over year.
- The Clinical Benefit: Spotting a gradual upward drift in blood sugar or blood pressure over two or three years allows you to intervene long before a metric crosses into pathological or clinical disease thresholds.
Questions to Ask Your Physician During Your Next Routine Review
Transforming routine lab reviews into collaborative clinical discussions ensures you get maximum clarity from your annual screening. Consider asking your provider the following targeted questions:
- “How have my key markers changed compared to my previous year’s report?”
- “Are any of my results trending toward the edge of the reference range, even if they are currently flagged as normal?”
- “What specific lifestyle or dietary modifications should I prioritize over the next six months based on these numbers?”
- “Do these lab findings warrant any secondary screenings or follow-up panels?”
By pairing proactive tracking with expert medical guidance at Tamhane Clinic, you build a sustainable, evidence-based foundation for lifelong wellness.
Medical Disclaimer: The lab reference ranges and clinical insights provided in this guide are intended strictly for educational and informational purposes. Reference intervals can vary slightly between different automated laboratories, testing equipment, and regional standards. A single laboratory value should never be used to self-diagnose or self-treat. Always consult your attending physician or healthcare provider for a personalized clinical interpretation of your diagnostic reports.
Frequently Asked Questions
Q: What is the difference between Fasting Blood Glucose and HbA1c?
A: Fasting Blood Glucose measures the concentration of sugar in your blood at a single moment in time. HbA1c acts like a 90-day movie, measuring the percentage of hemoglobin coated with sugar to reflect your average glucose control over the past 3 months.
Q: Why does my doctor look at cholesterol ratios instead of just Total Cholesterol?
A: Total Cholesterol includes both HDL (“good”) and LDL (“bad”) cholesterol. Ratios like Total Cholesterol to HDL provide a far clearer picture of cardiovascular risk and arterial health than an isolated total number.
Q: How often should I get an annual blood test done?
A: For healthy adults, a comprehensive blood panel once a year is standard for tracking baseline health trends. If you have underlying conditions like diabetes, dyslipidemia, or thyroid disorders, your doctor may recommend testing every 3 to 6 months.
Q: Do I need an appointment to consult at Tamhane Clinic?
A: No appointment is necessary. Tamhane Clinic operates completely on a walk-in basis in Kunjirwadi, Pune. You can walk in with your lab reports for a physician-led review.
Q: Should I panic if a single lab value comes back slightly high or low?
A: No. Standard reference ranges represent a population average. Temporary factors like hydration, sleep, acute stress, or a recent workout can shift minor values. Doctors always look at your overall personal multi-year trends rather than isolating a single minor fluctuation.
Q: How long do I need to fast before taking an annual blood test?
A: For tests requiring a fasting state—such as Fasting Blood Glucose and a comprehensive Lipid Profile—an 8 to 12-hour fast is standard. Plain water is allowed and encouraged to ensure you remain well-hydrated.
Q: Why are Vitamin D3 and B12 routinely checked in annual panels?
A: Deficiencies in Vitamin D3 (essential for bone density and immunity) and Vitamin B12 (critical for nerve function and RBC formation) are extremely common and often present as vague fatigue or body aches before leading to noticeable clinical symptoms.
Q: What do elevated liver enzymes (SGPT/SGOT) usually indicate?
A: Elevated SGPT (ALT) and SGOT (AST) indicate that liver cells are experiencing stress or mild inflammation. Common causes include fatty liver changes, alcohol intake, metabolic strain, or recent medication use, which can often be reversed with early lifestyle intervention.
Q: Can exercise or hydration on the day before a test affect my results?
A: Yes. Dehydration can artificially elevate markers like Creatinine and Hemoglobin, while intense, unaccustomed physical exercise can cause mild, temporary spikes in muscle enzymes and liver markers. It is best to stay normally hydrated and avoid extreme workouts right before a blood draw.
📥 Free Downloadable Resource
Annual Lab Report Explained Checklist – Don’t let medical jargon leave you guessing. Download our free, printer-friendly checklist designed to help you organize your past results, track multi-year health trends, and ask your physician the right questions during your next routine review at Tamhane Clinic!